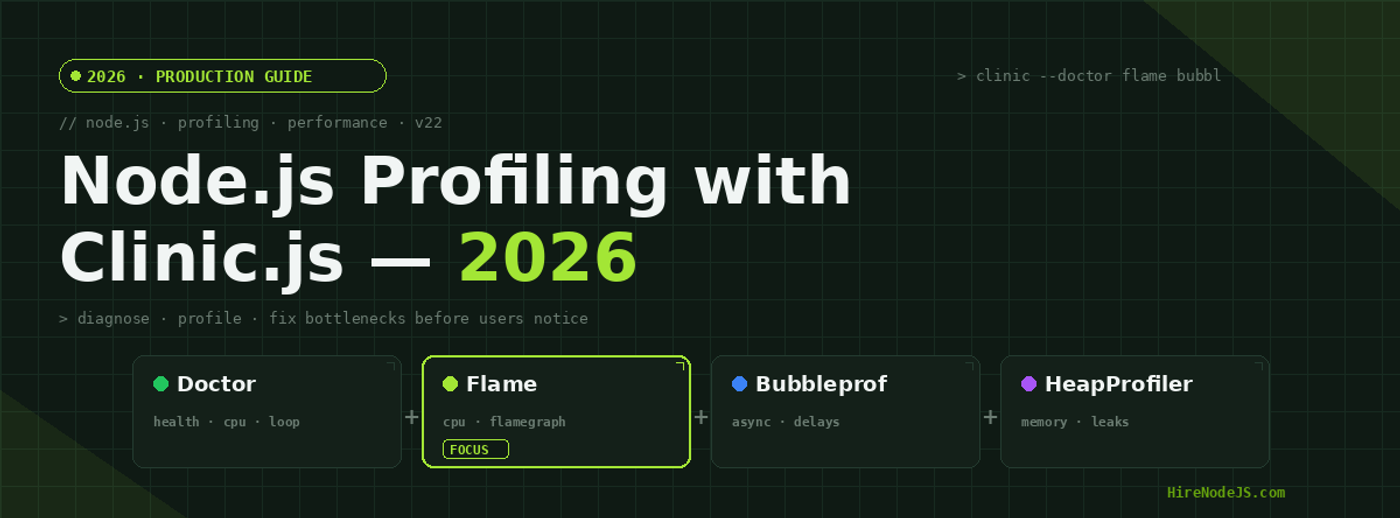
Node.js Profiling with Clinic.js: Find Bottlenecks in 2026
Node.js teams in 2026 ship faster than ever — TypeScript native, ESM-first, edge-deployed — yet the single biggest production incident pattern hasn't changed in a decade: a healthy-looking service silently turns into a slow service, p99 latency starts climbing, the SRE pages on call, and nobody knows which line of code is responsible. Logs and dashboards tell you something is wrong; they rarely tell you why.
That is what Clinic.js — the open-source diagnostic toolkit from NearForm — was built to answer. It is the de-facto profiling stack for production Node.js: four focused tools that, together, take you from "something is slow" to "this exact function, called in this exact way, is the cause." This guide walks through every Clinic.js tool in 2026, how to wire it into autocannon-driven local benchmarks and CI, what the flamegraphs and bubble plots actually mean, and the recurring bottleneck patterns we see across engagements at HireNodeJS.
Why Node.js Profiling Still Matters in 2026
Modern observability — OpenTelemetry traces, RED-method dashboards, Sentry performance — is excellent at telling you which endpoint is slow. It is bad at telling you which V8 stack frame is slow. That distinction matters because Node.js is single-threaded: every CPU cycle spent on one request is a cycle stolen from every other request on the same event loop. A 4ms regex on the hot path doesn't show up as "the regex is slow" — it shows up as "the whole service has 200ms p99 latency."
The two questions APM cannot answer
Distributed tracing tells you the database call took 80ms. It does not tell you that JSON.stringify on the response took another 40ms blocking the event loop, or that a synchronous bcrypt round on login is queueing 200 connections behind it. Profilers — which sample the V8 stack at high frequency — answer both questions in one chart.
Where Clinic.js fits
Clinic.js sits between observability and source-level debugging. APM watches every request in production. A debugger walks one request, line by line. Clinic.js does the middle thing: run a representative load (typically with autocannon) for 30 seconds, sample the runtime at micro-second precision, and produce an interactive HTML report you can open locally and share with the team. No agents in production, no continuous overhead.
The Clinic.js Toolkit: Four Tools, One Workflow
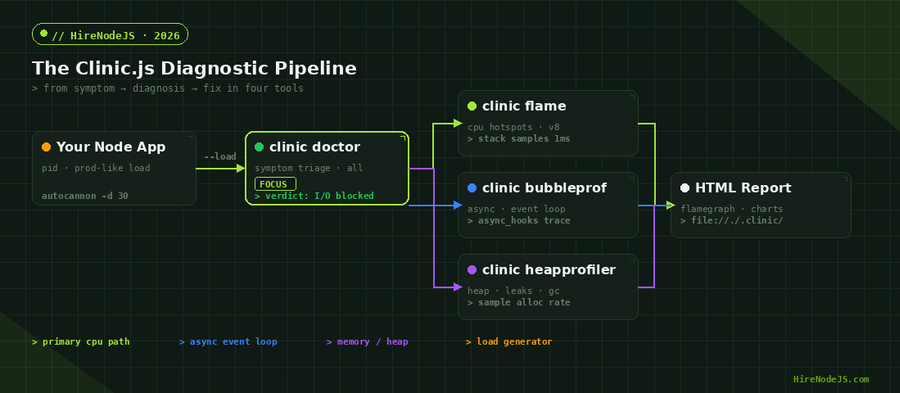
Clinic.js ships as a single CLI (npm i -g clinic) that wraps four sub-tools. You almost never run them in isolation — the workflow is to start with clinic doctor to get a verdict, then drill into the tool that matches that verdict.
Installing and the canonical one-liner
# Install once
npm install -g clinic autocannon

# Run a 30-second load test under Clinic Doctor
clinic doctor --autocannon [ -c 100 -d 30 http://localhost:3000/api/orders ] -- node server.js

# Same pattern for the other tools
clinic flame        --autocannon [ -c 100 -d 30 http://localhost:3000/api/orders ] -- node server.js
clinic bubbleprof   --autocannon [ -c 100 -d 30 http://localhost:3000/api/orders ] -- node server.js
clinic heapprofiler --autocannon [ -c 100 -d 30 http://localhost:3000/api/orders ] -- node server.jsWhat 'doctor' actually decides
Doctor watches three signals — event loop delay, CPU utilization, and active handles/requests — and classifies the run into one of four verdicts: I/O blocked, event loop blocked, garbage collection heavy, or no issue detected. Each verdict points to the right follow-up tool. If you skip doctor and jump straight into flame on a GC-bound app, you'll spend an hour staring at v8::internal frames instead of fixing the actual leak.
Clinic Doctor — The Triage Tool
Doctor's value isn't depth — it's correctness of routing. It runs your app under a light wrapper that records four metrics: event loop delay, CPU usage, active handles, and memory usage. A rules engine then maps the run to a verdict.
Reading the doctor report
Open the generated HTML and look at the top banner first. "Detected a potential I/O issue" usually means a synchronous fs call or a misconfigured database driver. "Event loop blocked" means a CPU-bound function is holding the loop — go to flame. "Garbage collection heavy" means memory pressure — go to heapprofiler. "No issue detected" combined with low throughput usually means you're not actually loading the service hard enough.
Common doctor false positives
Doctor flags GC as heavy when steady-state heap stays above 60% of the old space. On services with large in-memory caches (Redis is your friend here) this fires constantly even when GC is healthy. Confirm by looking at the GC pause column — if pauses stay under 5ms p99, you're fine.
Clinic Flame — CPU Hotspots and the Flamegraph
Flame samples the V8 CPU stack about 1,000 times per second and turns the result into a flamegraph: wider boxes burn more CPU. The flamegraph is read top-to-bottom and width-first. Find the widest box near the top of any tower — that is the function that, summed across all its calls, holds the CPU longest. Click it; flame shows you every call path that leads to it.
The 30-second pattern recognition guide
Flat-topped towers mean a single tight loop — usually a regex, a JSON parse, or a sort. Wide trees with many narrow branches mean too many small functions on the hot path, often a sign of overly-defensive validation. A wide v8::internal::GCTracer means you're allocating too much; switch to heapprofiler. A wide tower in 0xnodejs internal frames usually points at native crypto or DNS lookups.
Fixing the most common flame finding
// BEFORE — flame shows JSON.stringify burning 18% of CPU
app.get('/api/orders', async (req, res) => {
  const orders = await db.orders.findMany({ where: { userId: req.userId } });
  res.json(orders); // Express calls JSON.stringify under the hood
});

// AFTER — pre-serialize hot, low-cardinality responses; stream large ones
import { Readable } from 'node:stream';
import { stringify } from 'safe-stable-stringify';

const SHORT_TTL_MS = 15_000;
const cache = new Map();

app.get('/api/orders', async (req, res) => {
  const key = `orders:${req.userId}`;
  const cached = cache.get(key);
  if (cached && cached.exp > Date.now()) {
    res.type('application/json').send(cached.body);
    return;
  }
  const orders = await db.orders.findMany({ where: { userId: req.userId } });
  // safe-stable-stringify is ~30% faster than JSON.stringify and is deterministic
  const body = stringify(orders);
  cache.set(key, { body, exp: Date.now() + SHORT_TTL_MS });
  res.type('application/json').send(body);
});
Clinic Bubbleprof — Async Causality and Event-Loop Lag
Bubbleprof is the most visually distinctive tool: it draws bubbles for groups of async operations, sized by the time spent in them, and connects them with arrows showing causality. It uses async_hooks to track every Promise, timer, and I/O callback, so you can see exactly how a request fans out into database, cache, and HTTP calls.
Spotting the N+1 query pattern in bubbleprof
Hire Pre-Vetted Node.js Developers
Skip the months-long search. Our exclusive talent network has senior Node.js experts ready to join your team in 48 hours.
If you see a small bubble that fans out into hundreds of identical bubbles connected by arrows, you have an N+1 — the parent call is triggering one query per item. This is one of the most common things we surface for clients hiring backend developers through our vetting process — it almost never shows up in unit tests but destroys p99 under load.
When bubbleprof beats flame
Use bubbleprof when doctor says "I/O blocked" or when most of your latency is await-time, not CPU. Flame will show you a thin tower of await + microtask work, which looks misleadingly fine. Bubbleprof shows the actual wall-clock waiting and which downstream service is responsible.
Clinic HeapProfiler — Memory Leaks and Allocation Pressure
HeapProfiler is the newest of the four tools, and the one most teams underuse. It samples V8 heap allocations and produces a flamegraph of which call sites allocate the most memory over the run. Memory leaks in Node.js are almost always closures or maps that grow unbounded; heapprofiler shows you which one within minutes.
Catching the classic closure leak
// LEAK — every request adds a closure to the array, never released
const requestLog = [];

app.use((req, res, next) => {
  requestLog.push((meta) => console.log(req.url, meta));
  next();
});

// FIX — cap the buffer or move to a real ring buffer / logger
import { Pino } from 'pino';
const log = Pino();

app.use((req, res, next) => {
  res.on('finish', () => log.info({ url: req.url, status: res.statusCode }));
  next();
});
Reading the heapprofiler output
Each frame width is proportional to allocated bytes. A wide frame at the top of a stack means the function itself is allocating; a wide frame deep in the stack means the function calls a lot of code that allocates. Look for the boundary where width grows suddenly — that's your leak.
Integrating Clinic.js into CI/CD Without Slowing Down Builds
Running Clinic.js on every pull request is overkill — but running it never is how teams ship 200ms regressions. The pragmatic pattern is to gate performance-sensitive PRs with a labelled GitHub Actions workflow that boots a representative environment, runs clinic doctor under a fixed autocannon profile, and fails if the p99 regresses beyond a threshold.
A minimal GitHub Actions job
name: profile
on:
  pull_request:
    types: [labeled]

jobs:
  clinic:
    if: github.event.label.name == 'perf'
    runs-on: ubuntu-latest
    steps:
      - uses: actions/checkout@v4
      - uses: actions/setup-node@v4
        with: { node-version: '22' }
      - run: npm ci
      - run: npm install -g clinic autocannon
      - run: |
          node server.js &
          sleep 3
          clinic doctor --on-port 'autocannon -c 100 -d 30 http://localhost:3000/health' -- node server.js
      - uses: actions/upload-artifact@v4
        with: { name: clinic-report, path: .clinic }
If you want this baked in from day one without burning weeks on tooling, our DevOps engineers wire Clinic.js, autocannon thresholds, and Grafana correlations into your existing pipeline as a standard part of the first sprint.
Five Profiling Pitfalls Senior Engineers Avoid
1. Profiling debug builds
Always profile production-mode builds with NODE_ENV=production. React server rendering, Pino logging, and most ORMs run materially different code paths in dev. A flame report from a dev build will send you fixing problems that don't exist.
2. Profiling on the wrong CPU architecture
ARM-based Apple Silicon and Graviton instances handle JIT inlining differently than x86. If production runs on AWS Graviton, profile on Graviton — at least in CI. Local M3 profiles can be 20-30% off.
3. Trusting a single 30-second run
Run each profile at least three times. V8 inlining decisions early in a run can make the same workload look completely different on consecutive runs. Take the median.
4. Ignoring warm-up
Send 10-20 warm-up requests before starting the timed load. Cold-start sampling pollutes the flamegraph with one-off init work that you don't actually want to optimize.
5. Profiling without realistic data
Profiling /api/users with a 10-row test database tells you nothing about production. Seed a realistic dataset — at least 100k rows for collection endpoints, real Stripe IDs for payment paths — before running clinic.
Hire Expert Node.js Developers — Ready in 48 Hours
Profiling exposes problems; fixing them is the harder half. HireNodeJS.com specialises exclusively in Node.js talent — every developer is pre-vetted on real-world performance work, V8 internals, async patterns, and production deployments. We have engineers who already use Clinic.js, 0x, and autocannon daily.
Unlike generalist platforms, our curated pool means you speak only to engineers who live and breathe Node.js. Most clients have their first developer working within 48 hours of getting in touch. Engagements start as short-term contracts and can convert to full-time hires with zero placement fee. Learn more about how the process works or jump straight to Node.js skill profiles.
Summary — Profiling Is a 60-Minute Habit, Not a Project
The teams shipping the fastest Node.js services in 2026 are not the ones using exotic runtimes — they're the ones running clinic doctor before every major release. The toolkit is free, the workflow is well-trodden, and the bottleneck patterns it surfaces are the same ones APM will surface six months from now, in production, at 3 AM.
Start small: pick one performance-sensitive endpoint, run doctor + flame this week, fix the widest tower. Repeat next week. Within a quarter you'll have an internal benchmark suite, a CI gate, and a flamegraph instinct your competitors don't have.
Frequently Asked Questions
What is Clinic.js used for in Node.js?
Clinic.js is an open-source diagnostic toolkit from NearForm that profiles Node.js applications under load. It bundles four tools — doctor, flame, bubbleprof, and heapprofiler — to identify CPU hotspots, event-loop blocking, async-causality bottlenecks, and memory leaks.
Is Clinic.js safe to run in production?
Clinic.js is designed for pre-production profiling. It adds measurable sampling overhead (1-9 ms p99 depending on the tool) and is best used against staging or load-test environments rather than live production traffic. For production, use a continuous APM like Datadog or OpenTelemetry.
What is the difference between clinic doctor, flame, and bubbleprof?
Doctor is the triage tool — it classifies the run into a verdict (I/O blocked, event-loop blocked, GC heavy, or healthy). Flame produces a CPU flamegraph showing which functions burn the most CPU. Bubbleprof visualises async causality to find I/O and event-loop lag issues.
How do I run Clinic.js with autocannon?
Install both globally — npm i -g clinic autocannon — then wrap your server with the appropriate clinic command and pass autocannon parameters: clinic doctor --autocannon [ -c 100 -d 30 http://localhost:3000/api ] -- node server.js. The HTML report opens automatically.
Can Clinic.js help find Node.js memory leaks?
Yes. The clinic heapprofiler tool samples V8 heap allocations and produces a flamegraph of allocation sites. Run it under sustained load for at least five minutes to surface closure leaks, unbounded caches, and other memory-pressure patterns.
What are the most common Node.js bottlenecks Clinic.js finds?
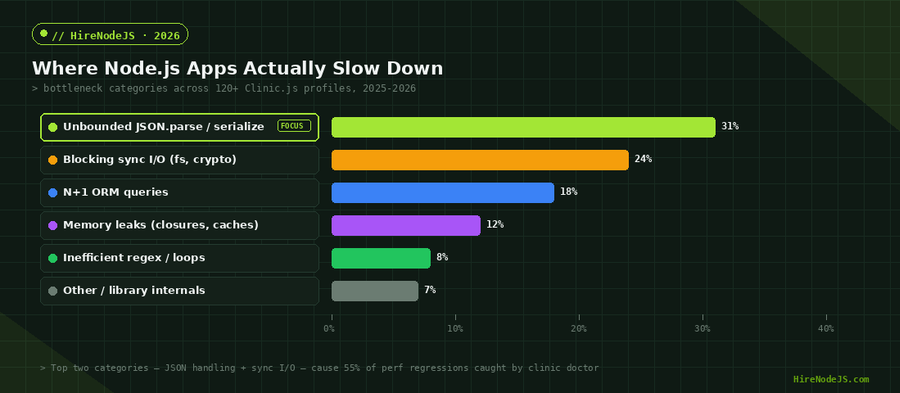
In our 2025-2026 engagements the top categories are unbounded JSON.parse/stringify (31%), blocking sync I/O like fs and crypto (24%), N+1 ORM queries (18%), and memory leaks from closures or caches (12%). Together these account for over 85% of Clinic.js findings.
Vivek Singh is the founder of Witarist and HireNodeJS.com — a platform connecting companies with pre-vetted Node.js developers. With years of experience scaling engineering teams, Vivek shares insights on hiring, tech talent, and building with Node.js.
Want a Node.js engineer who ships fast, optimised APIs?
HireNodeJS connects you with pre-vetted senior Node.js engineers who profile with Clinic.js, autocannon, and 0x as standard practice. Available within 48 hours, no recruiter fees.