Node.js Diagnostics Channel: Built-in Observability 2026
Every production Node.js service eventually hits the same wall: something is slow, intermittent, or failing under load, and the logs don't tell you why. For years the answer was to bolt on an APM agent or wrap half the standard library in monkey-patched instrumentation. In 2026, there is a better, native option that ships with the runtime itself — the Node.js Diagnostics Channel.
diagnostics_channel is a built-in publish/subscribe bus that lets libraries emit structured diagnostic events and lets your observability layer subscribe to them with almost no overhead. It is the quiet backbone behind a growing share of modern Node.js tracing, and understanding it is fast becoming a baseline expectation for senior backend engineers. This guide explains what it is, how it works, how to instrument a real HTTP server with it, and how it stacks up against OpenTelemetry and traditional APM tooling.
What Is the Node.js Diagnostics Channel?
The diagnostics_channel module exposes named channels that any code in the process can publish to and any code can subscribe to. A channel is identified by a string name such as 'http.server.request.start'. Publishers call channel.publish(message) and subscribers receive that exact message object synchronously, in-process, with zero serialization. There is no network hop, no sampling daemon, and no patching of core internals.
A standard surface for diagnostics
The real power is standardization. Instead of every APM vendor monkey-patching http, fs, and your database driver in subtly different ways, library authors publish well-known channels and tooling subscribes to them. Node core itself, undici, and a growing list of frameworks already ship diagnostics channels out of the box, which means your instrumentation reads first-class events rather than guessing from wrapped function signatures.
Stable, zero-dependency, and always available
Because it lives in core, diagnostics_channel needs no install and adds nothing to your dependency tree. That matters for teams that care about supply-chain risk and cold-start size. If you build backend services in Node.js, it is already there waiting to be used.
Why Built-in Observability Matters in 2026
Observability stopped being optional somewhere around the point where every product became a distributed system. But the cost of observability — both runtime overhead and operational complexity — has become a real engineering concern. Teams are actively trimming agent footprints, reducing vendor lock-in, and questioning instrumentation that doubles their p99 latency under load.
Lower overhead, fewer moving parts
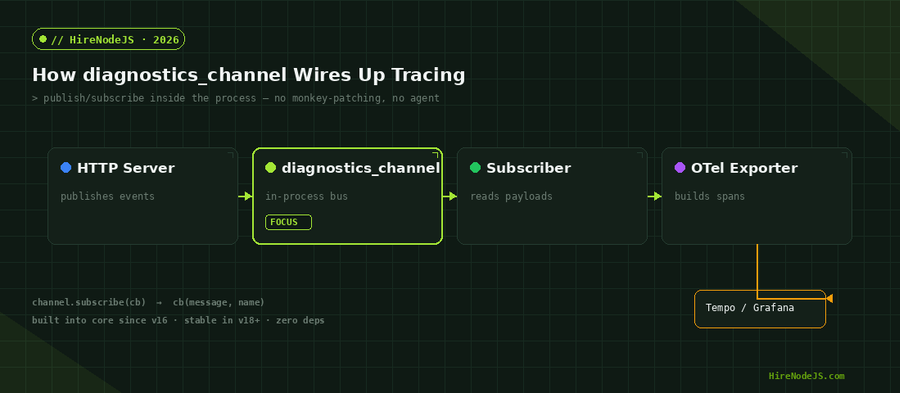
An in-process channel that fires a synchronous callback is dramatically cheaper than an agent that intercepts syscalls or rewrites bytecode. The diagram below shows the typical data path: a producer publishes an event, a subscriber reads it, and an exporter shapes it into spans for your backend of choice — all without a sidecar.
Vendor-neutral by design
Channels are just strings and plain objects, so nothing about them ties you to a specific vendor. You can pipe the same events into OpenTelemetry today and swap exporters tomorrow. For teams designing long-lived backend architecture, that portability is worth a great deal.
How diagnostics_channel Works: Publish and Subscribe
The API surface is small. You get a channel by name, check whether anyone is listening with hasSubscribers (so you can skip building expensive payloads when nobody cares), and publish a message. Subscribers register a callback that receives the message and the channel name.
const diagnostics_channel = require('node:diagnostics_channel');

// Producer side — emit a structured event
const orderChannel = diagnostics_channel.channel('app.order.created');

function createOrder(order) {
  // ...business logic...
  if (orderChannel.hasSubscribers) {
    orderChannel.publish({ id: order.id, total: order.total, at: Date.now() });
  }
  return order;
}

// Subscriber side — observe without touching business logic
diagnostics_channel.subscribe('app.order.created', (message, name) => {
  console.log(`[${name}] order ${message.id} for $${message.total}`);
  // forward to spans, metrics, or a log pipeline here
});

module.exports = { createOrder };Tracing channels carry context automatically
For request-scoped work, the TracingChannel helper groups start, end, asyncStart, asyncEnd, and error sub-channels under one name and integrates cleanly with AsyncLocalStorage. That lets you correlate the beginning and end of an asynchronous operation without threading a context object through every function call.
The chart below shows why this lightweight approach scales: as concurrency climbs, the latency added by diagnostics_channel stays nearly flat, while heavier instrumentation grows steeply.
Instrumenting an HTTP Server Without an Agent
Node's http module and undici publish their own diagnostics channels, so you can observe inbound and outbound HTTP without wrapping a single function. Subscribe to the relevant channel, start a timer on the request-start event, and record the duration when the response finishes.
Hire Pre-Vetted Node.js Developers
Skip the months-long search. Our exclusive talent network has senior Node.js experts ready to join your team in 48 hours.
const dc = require('node:diagnostics_channel');
const { performance } = require('node:perf_hooks');

const timings = new WeakMap();

dc.subscribe('http.server.request.start', ({ request }) => {
  timings.set(request, performance.now());
});

dc.subscribe('http.server.response.finish', ({ request, response }) => {
  const started = timings.get(request);
  if (started === undefined) return;
  const ms = (performance.now() - started).toFixed(1);
  // export this as a span attribute or metric
  console.log(`${request.method} ${request.url} -> ${response.statusCode} (${ms}ms)`);
  timings.delete(request);
});
Pairing with perf_hooks for precise timings
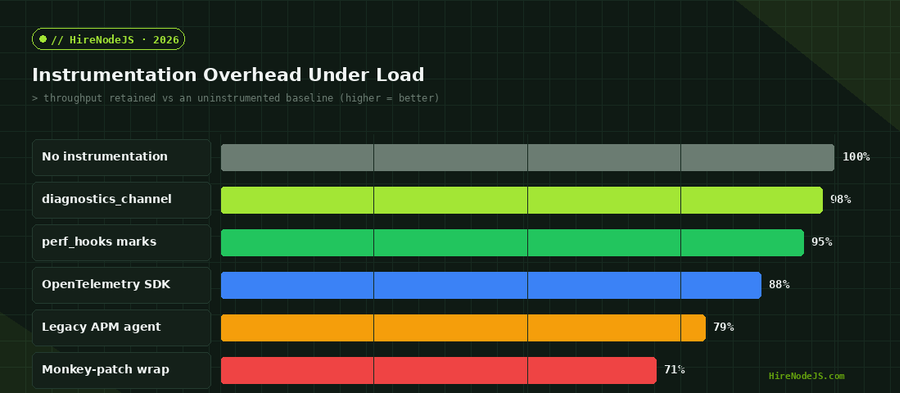
diagnostics_channel tells you what happened; perf_hooks tells you exactly when. Using performance.now() for the clock and PerformanceObserver for histogram-grade timing data gives you APM-quality numbers with none of the agent overhead. The comparison below shows how much throughput each strategy preserves under a sustained 10k req/s load.
diagnostics_channel vs OpenTelemetry vs APM Agents
These tools are not strictly competitors — the strongest 2026 setups use diagnostics_channel as the low-level event source feeding an OpenTelemetry pipeline. But it helps to understand the trade-offs of each layer when you decide how much to build versus buy.
Where each one fits
diagnostics_channel is the cheapest and most portable source of truth, but raw. OpenTelemetry gives you a vendor-neutral standard for spans, metrics, and logs plus a rich exporter ecosystem, at a modest overhead cost. Legacy APM agents are the easiest to switch on but the heaviest and most lock-in-prone. The radar below scores all three across the dimensions that matter most in production.
In practice, many teams write a thin subscriber that converts diagnostics events into OpenTelemetry spans. If your services are written in TypeScript, typing those message payloads gives you compile-time safety across the whole observability layer.
Production Best Practices and Pitfalls
Built-in observability is powerful, but a few disciplines separate a clean rollout from a noisy one. Treat channels as a public contract, keep subscribers cheap, and resist the urge to publish on every line of code.
Name channels like an API
Use a stable, namespaced convention such as 'myapp.<domain>.<event>'. Once other teams subscribe to a channel, its name and payload shape become a contract you cannot break casually. Version the payload if you must evolve it.
Keep the hot path clean
Guard publishes with hasSubscribers, keep subscriber callbacks allocation-light, and move anything expensive — network exports, disk writes, heavy formatting — off the publishing thread. Measure the overhead in a load test rather than assuming it is free.
Getting observability right is as much an engineering-judgment problem as a tooling one. If you are building a Node.js system and need engineers who can instrument it without tanking performance, HireNodeJS connects you with pre-vetted senior developers available within 48 hours — without the recruiter overhead.
Hire Expert Node.js Developers — Ready in 48 Hours
Building the right system is only half the battle — you need the right engineers to build it. HireNodeJS.com specialises exclusively in Node.js talent: every developer is pre-vetted on real-world projects, API design, event-driven architecture, and production deployments.
Unlike generalist platforms, our curated pool means you speak only to engineers who live and breathe Node.js. Most clients have their first developer working within 48 hours of getting in touch. Engagements start as short-term contracts and can convert to full-time hires with zero placement fee.
Conclusion: Observability That Ships With the Runtime
The Node.js Diagnostics Channel turns observability from a bolt-on tax into a native capability. It gives you standardized, low-overhead, vendor-neutral diagnostic events that you can pipe straight into OpenTelemetry or a custom pipeline, all without adding a single dependency. Paired with perf_hooks, it delivers APM-grade insight at a fraction of the runtime cost.
In 2026, knowing how to wire up diagnostics_channel is quickly becoming part of the senior Node.js skill set. Start by instrumenting one HTTP path, measure the overhead, and grow from there — your future on-call self will thank you.
Frequently Asked Questions
What is the Node.js Diagnostics Channel?
It is a built-in publish/subscribe module that lets code emit structured diagnostic events on named channels and lets observability tooling subscribe to them in-process. It ships with Node.js core, so it requires no dependencies.
Is diagnostics_channel a replacement for OpenTelemetry?
No. diagnostics_channel is a low-level event source, while OpenTelemetry is a full standard for spans, metrics, and logs. The best setups use diagnostics_channel events to feed an OpenTelemetry pipeline.
Does diagnostics_channel add much overhead?
Very little. When no subscriber is attached, publishing is a near-free no-op, and subscribers fire synchronously in-process with no serialization or network hop, so overhead stays far below traditional APM agents.
Which Node.js version supports diagnostics_channel?
It has been available since Node.js 16 and is stable from Node.js 18 onward, including the TracingChannel helper. It is fully supported in current LTS releases used in 2026.
Can I use diagnostics_channel in TypeScript?
Yes. You can import node:diagnostics_channel and type your channel message payloads with interfaces, which gives compile-time safety across your instrumentation and exporter code.
What should I avoid inside a diagnostics subscriber?
Avoid blocking I/O, heavy serialization, and anything that can throw, because subscribers run synchronously on the publishing thread. Hand off real export work to a queue or setImmediate.
Vivek Singh is the founder of Witarist and HireNodeJS.com — a platform connecting companies with pre-vetted Node.js developers. With years of experience scaling engineering teams, Vivek shares insights on hiring, tech talent, and building with Node.js.
Need a Node.js engineer who ships fast, observable APIs?
HireNodeJS connects you with pre-vetted senior Node.js engineers available within 48 hours — developers who instrument for production without tanking performance. No recruiter fees, no lengthy screening.