Node.js Garbage Collection Tuning in 2026: V8 Heap & Flags
Node.js gives you a remarkably productive runtime, but it also hands you a memory manager you never explicitly asked for. Every object you allocate lives inside V8's garbage-collected heap, and every few milliseconds the garbage collector quietly pauses your event loop to reclaim what you are no longer using. For most apps that overhead is invisible. For a high-throughput API serving thousands of requests per second, those pauses become the difference between a p99 latency of 20 ms and one of 200 ms.
In 2026, with Node.js shipping a modern V8 and most production workloads running inside memory-capped containers, garbage collection tuning has moved from an exotic skill to a core production competency. This guide explains how the V8 heap is structured, which flags actually move the needle, how to measure GC behaviour instead of guessing, and how to avoid the out-of-memory crashes that catch teams off guard when they containerize. Everything here is runnable on a stock Node.js install.
How V8 Manages Memory in Node.js
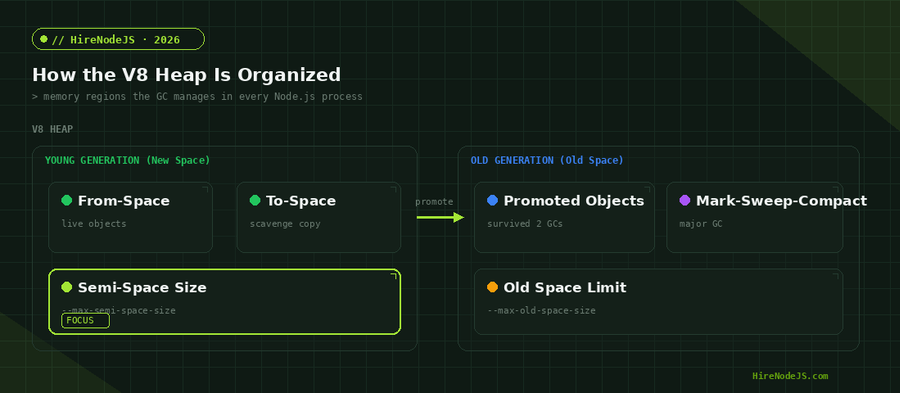
V8 splits the heap into generations based on a simple observation: most objects die young. A request handler creates request and response objects, a few closures, some intermediate strings, and then throws nearly all of it away when the response is sent. V8 optimizes for this by collecting short-lived objects cheaply and frequently, and long-lived objects expensively and rarely.
The young generation and the scavenge collector
New objects are allocated into the young generation, also called New Space. It is divided into two equal halves called semi-spaces. When the active half fills up, the Scavenge collector runs: it copies the still-live objects into the other half and discards everything else in one sweep. Because it only touches live objects and the young generation is small, a scavenge is fast — typically well under a millisecond — but it runs often.
The old generation and Mark-Sweep-Compact
Any object that survives two scavenges is promoted to the old generation, or Old Space. This is where long-lived state lives: caches, connection pools, module singletons. Old Space is collected by Mark-Sweep-Compact, a much heavier algorithm that marks reachable objects, sweeps the dead ones, and compacts the survivors. Major collections are rarer but far more disruptive, and they are the pauses you feel in your tail latency.
The GC Flags That Actually Matter
V8 exposes dozens of flags, but only a handful are worth touching in production. The rest are best left at their carefully chosen defaults. Two flags do most of the useful work: one controls how big the young generation can grow, and the other caps the entire old generation.
--max-semi-space-size: the highest-leverage knob
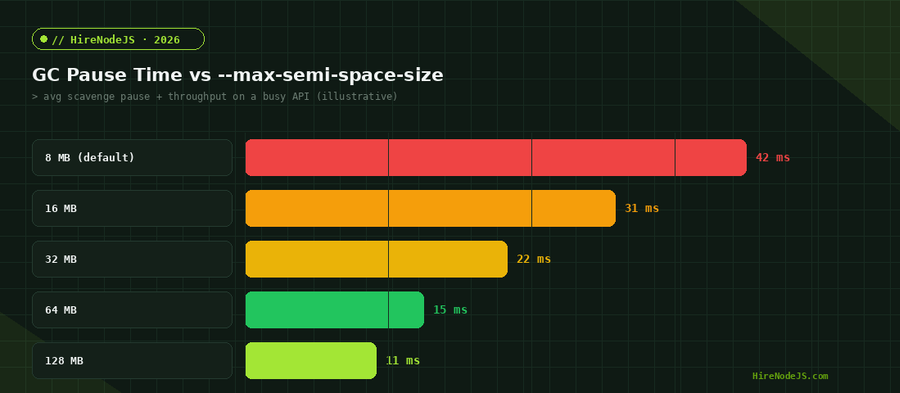
This flag sets the maximum size in megabytes of each semi-space in the young generation. The default is conservative — historically 16 MB on 64-bit systems, and smaller in constrained environments. Raising it gives the fast Scavenge collector more room to work, so short-lived garbage is reclaimed in the young generation instead of being prematurely promoted into Old Space. Fewer promotions means fewer expensive major collections. Throughput typically improves quickly up to around 64–128 MB, then flattens out.
--max-old-space-size: the safety ceiling
This flag caps the old generation. It is what most people mean when they say they are 'setting the heap size.' The critical detail in 2026 is that V8 does not automatically read your container memory limit. A Node.js process inside a 512 MB container will still assume it has far more headroom unless you tell it otherwise, and it will happily allocate its way to an OOMKilled event. Set this flag to roughly 75–80% of the container's memory limit, leaving room for native buffers, the stack, and non-heap memory.
Measuring GC Before You Tune It
Tuning without measurement is superstition. Before changing a single flag, capture what your GC is actually doing so you can prove an improvement instead of imagining one. Node.js gives you several built-in ways to do this with zero external dependencies.
Tracing every collection
The fastest way to see GC activity is to ask V8 to log it. Run your process with --trace-gc and every collection prints a line showing its type, duration, and how much memory was reclaimed. Pipe it to a file during a load test and you have a complete picture of scavenge frequency versus major-GC frequency.
// Programmatic GC observation using the built-in PerformanceObserver.
// Run with:  node --expose-gc gc-stats.js   (or just observe in normal runs)
const { PerformanceObserver, constants } = require('node:perf_hooks');

const KIND = {
  [constants.NODE_PERFORMANCE_GC_MINOR]: 'scavenge',
  [constants.NODE_PERFORMANCE_GC_MAJOR]: 'mark-sweep-compact',
  [constants.NODE_PERFORMANCE_GC_INCREMENTAL]: 'incremental',
  [constants.NODE_PERFORMANCE_GC_WEAKCB]: 'weak-callbacks',
};

const stats = { count: 0, totalMs: 0, major: 0 };

const obs = new PerformanceObserver((list) => {
  for (const entry of list.getEntries()) {
    stats.count += 1;
    stats.totalMs += entry.duration;
    if (entry.detail?.kind === constants.NODE_PERFORMANCE_GC_MAJOR) stats.major += 1;
    // entry.duration is the pause in ms; log the slow ones
    if (entry.duration > 10) {
      console.log(`slow GC: ${KIND[entry.detail?.kind] ?? 'gc'} took ${entry.duration.toFixed(1)}ms`);
    }
  }
});
obs.observe({ entryTypes: ['gc'] });

// Print a rollup every 10s so you can compare flag settings under load.
setInterval(() => {
  const { heapUsed, heapTotal } = process.memoryUsage();
  console.log(JSON.stringify({
    gcCount: stats.count,
    majorGc: stats.major,
    avgPauseMs: +(stats.totalMs / Math.max(stats.count, 1)).toFixed(2),
    heapUsedMB: Math.round(heapUsed / 1048576),
    heapTotalMB: Math.round(heapTotal / 1048576),
  }));
}, 10_000).unref();
Tuning for Containers and Kubernetes
The single most common GC-related production incident in 2026 is not a slow app — it is a pod that keeps getting OOMKilled. The root cause is almost always the same: V8's default heap sizing ignores cgroup memory limits, so the process plans for more memory than the container will ever grant it.
Hire Pre-Vetted Node.js Developers
Skip the months-long search. Our exclusive talent network has senior Node.js experts ready to join your team in 48 hours.
Sizing the heap to the cgroup
If you run Node.js on Kubernetes, treat the container memory limit as the source of truth and derive the heap from it. A good rule is to reserve about 20–25% for non-heap memory and pass the rest to --max-old-space-size. The same discipline that keeps your Docker images small and reproducible applies here: be explicit, and never rely on a default the runtime guessed for a different machine.
# Pass GC flags via NODE_OPTIONS so every entrypoint inherits them.
# For a container with a 512Mi memory limit:
#   ~384Mi old space (75%), 64Mi semi-space headroom for throughput.
FROM node:24-slim
WORKDIR /app
COPY package*.json ./
RUN npm ci --omit=dev
COPY . .
ENV NODE_OPTIONS="--max-old-space-size=384 --max-semi-space-size=64"
EXPOSE 3000
CMD ["node", "server.js"]
Verifying the runtime sees your limit
Confirm the flags took effect rather than assuming. A one-line check at boot logs the actual heap ceiling V8 is enforcing, which is invaluable when you are debugging a memory issue alongside your observability stack.
Common GC Anti-Patterns That Hurt Throughput
Most GC pain is self-inflicted at the application level, not the flag level. No amount of tuning will save a service that allocates recklessly. The goal is to keep short-lived objects short-lived and to stop accidentally promoting garbage into Old Space.
Unbounded caches and accidental retention
A plain object or Map used as an in-process cache that never evicts is the classic slow memory leak. Every entry survives long enough to be promoted to Old Space, Old Space grows, major collections get slower, and eventually you hit the heap ceiling. Bound your caches, use a real LRU, and prefer WeakMap when the key's lifetime should govern the value's lifetime.
Giant closures and buffer churn
Capturing large objects in long-lived closures keeps them alive far longer than intended. Allocating and discarding large Buffers on every request thrashes the heap. Reuse buffers where you can, stream large payloads instead of materializing them, and watch for arrays that grow without bound across requests.
A Practical GC Tuning Checklist
Pulling it together, here is the sequence that reliably produces a faster, more predictable Node.js service without cargo-culting flags you do not understand.
First, baseline with --trace-gc and the PerformanceObserver rollup above under a realistic load test. Second, set --max-old-space-size to about 75% of your container limit so the process fails predictably instead of being OOMKilled. Third, raise --max-semi-space-size to 64 MB and re-measure; keep it only if major-GC frequency and average pause actually drop. Fourth, fix application-level allocation: bound caches, stream large payloads, and eliminate accidental retention. Fifth, lock the chosen flags into NODE_OPTIONS in your image so every environment is identical.
Diagnosing GC pauses, sizing heaps for containers, and reading flame graphs are exactly the skills that separate a senior backend engineer from a junior one. If you are building a performance-sensitive Node.js system and need that expertise on your team, HireNodeJS connects you with pre-vetted senior developers available within 48 hours — without the recruiter overhead.
GC tuning rarely lives in isolation. It sits next to Node.js performance optimization work and is often handled by the same backend developers who own your API layer and deployment pipeline.
Hire Expert Node.js Developers — Ready in 48 Hours
Building the right system is only half the battle — you need the right engineers to build it. HireNodeJS.com specialises exclusively in Node.js talent: every developer is pre-vetted on real-world projects, API design, event-driven architecture, and production deployments.
Unlike generalist platforms, our curated pool means you speak only to engineers who live and breathe Node.js. Most clients have their first developer working within 48 hours of getting in touch. Engagements start as short-term contracts and can convert to full-time hires with zero placement fee.
Conclusion
Garbage collection in Node.js is not a black box you have to accept blindly. Once you understand that the heap is split into a fast young generation and a slow old generation, the tuning story becomes simple: give the young generation enough room to reclaim short-lived garbage, cap the old generation safely below your container limit, and fix the application-level allocation patterns that promote junk into Old Space.
The highest-leverage moves are raising --max-semi-space-size for throughput and setting --max-old-space-size to about 75% of your memory limit for stability — but only after you have measured GC behaviour under realistic load. Tune what you can prove, lock it into your image, and your Node.js services will be both faster and far more predictable in production.
Frequently Asked Questions
What is the most important Node.js garbage collection flag to tune?
--max-semi-space-size has the highest leverage for throughput. Raising it (e.g. to 64 MB) lets the fast scavenge collector reclaim short-lived objects in the young generation instead of promoting them, which reduces expensive major collections.
How do I set the Node.js heap size for a Docker or Kubernetes container?
Set --max-old-space-size to roughly 75% of the container memory limit. V8 does not read cgroup limits automatically, so without this the process can exceed the limit and be OOMKilled.
What is the difference between New Space and Old Space in V8?
New Space (the young generation) holds new, mostly short-lived objects and is collected quickly and often by the Scavenge collector. Old Space holds objects that survived two scavenges and is collected rarely but expensively by Mark-Sweep-Compact.
How do I measure garbage collection in Node.js without external tools?
Run with --trace-gc to log every collection, or use the built-in PerformanceObserver with entryTypes ['gc'] to capture pause durations and GC kinds programmatically. Compare runs before and after changing flags.
Does increasing --max-semi-space-size always improve performance?
No. Throughput improves quickly up to about 64–128 MB and then flattens, while memory usage keeps rising. Always measure under realistic load and keep the change only if major-GC frequency and average pause actually drop.
Why does my Node.js pod keep getting OOMKilled?
Most often because --max-old-space-size is unset or set at or above the container limit. V8 plans for more heap than the container grants, so the kernel kills the process before V8 runs its final GC. Cap the old space below the limit.
Vivek Singh is the founder of Witarist and HireNodeJS.com — a platform connecting companies with pre-vetted Node.js developers. With years of experience scaling engineering teams, Vivek shares insights on hiring, tech talent, and building with Node.js.
Want a Node.js engineer who ships fast, optimised APIs?
HireNodeJS connects you with pre-vetted senior Node.js engineers who know V8, GC tuning, and production performance — available within 48 hours. No recruiter fees, no lengthy screening.