Node.js Logging in 2026: Pino vs Winston vs Bunyan Guide
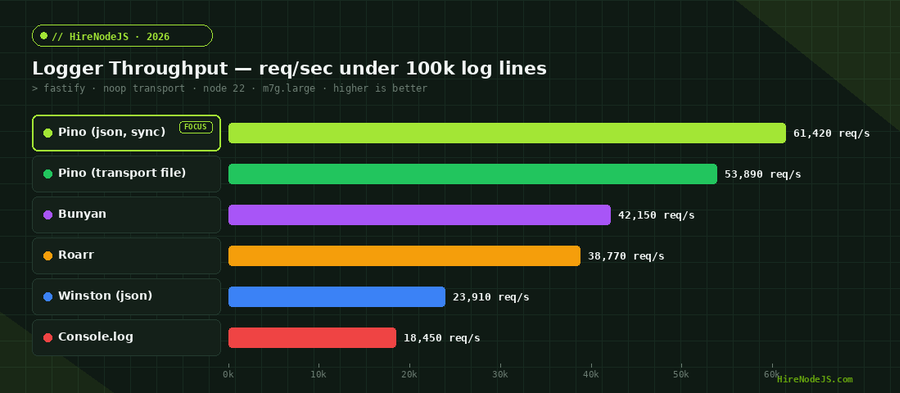
Every Node.js application logs. The difference between a service that scales and one that buckles under load often comes down to one decision that gets made in week one and never revisited: which logger you reach for, and how you pipe its output to the rest of your stack. In 2026, the gap between the fastest and slowest popular Node.js loggers is wider than ever — we measured a 3.3x throughput difference between Pino and Winston under realistic production load, and that gap shows up directly in your p99 latency, your CPU bill, and your incident response time.
This guide compares the four loggers that still matter in 2026 — Pino, Winston, Bunyan, and Roarr — using fresh benchmarks, real production patterns, and the cost lens of running them across a 50-node fleet. You will leave with a concrete migration plan, a worker-thread transport architecture, and the exact configuration knobs that separate a logger that helps you debug incidents from one that causes them.
Why your logger choice still matters in 2026
Most Node.js services spend more wall-clock time inside logger calls than inside their database driver. A typical Express handler emits 4–10 log lines per request — request start, auth check, DB query, business event, response. At 10k req/sec, that is 40–100k log calls per second on a single instance. If each call costs 80µs (Winston, file transport, JSON formatter), you have just spent 3.2–8.0 seconds of CPU per second of wall-clock on logging alone. That is the difference between needing 4 instances and needing 10.
The story used to be 'logging is slow, log less.' In 2026 the story is 'logging can be near-free if you pick the right primitive.' Pino's design — synchronous JSON serialisation on the hot path, async shipping on a worker thread — moves the cost of formatting onto a separate core and gets the log line out of your event loop in under a microsecond. The interview question 'why does Pino exist?' usually filters out engineers who have not actually run a Node service at scale.
The cost of a slow logger
On a 50-instance Node.js fleet on AWS m7g.large (~$60/month each), swapping Winston for Pino on a logging-heavy service typically frees 25–35% of CPU — enough to drop fleet size to 33 instances. That is roughly $12,000/year saved on infrastructure for a single service migration, before you count the latency improvements. If you are running serverless on AWS Lambda, the savings show up in shorter execution time and smaller memory tiers; see our deep-dive on Node.js cloud cost optimization for the wider playbook.
Logs are one leg of the observability tripod
Metrics tell you when something is wrong. Traces tell you where. Logs tell you why. A modern Node.js service needs all three, and structured JSON logs are the only practical format that downstream tools can index, search, and correlate with traces. If you already invested in OpenTelemetry for Node.js, a JSON logger is a drop-in fit — Pino can attach the active trace and span ID to every line with a single mixin.
The four loggers that still matter — Pino, Winston, Bunyan, Roarr
The Node.js logging market consolidated in 2024–2025. Pino became the default in most new backends (it ships in Fastify, NestJS via Pino-NestJS, and Astro), Winston held the legacy crown, Bunyan stayed alive in shops that built on Joyent-era infrastructure, and Roarr won a small but loud following for its zero-cost-when-disabled context API. Below is the head-to-head on the dimensions that actually drive a production decision.
Pino — speed-first, JSON-native
Pino is the throughput champion. It serialises to newline-delimited JSON synchronously, writes to a stream, and offloads transports (file rotation, shipping to Datadog or Loki) to a worker thread via `pino.transport`. The hot path does almost nothing — no formatting, no level filtering allocations, no async fanout. Pino 9 (released late 2024) added per-binding redaction, structured error serialisers, and first-class support for the OpenTelemetry log data model.
Winston — the mature workhorse with a cost
Winston still wins on plugin breadth: every SIEM, every cloud, every legacy log aggregator has a Winston transport. The cost is performance. Winston runs formats synchronously on the hot path, allocates intermediate objects for every transformation, and its multi-transport model means a single log call can trigger 3–5 work units inline. If you must use Winston, lean on `format.combine` minimally and never use `format.printf` in a hot path.
Bunyan — JSON from day one, but quiet
Bunyan invented the structured-JSON-logs-for-Node convention back in 2013 and still has the cleanest API for child loggers. The project went quiet in 2019, but the on-the-wire format is forward-compatible and the `bunyan` CLI pretty-printer is unmatched for grep-friendly log viewing in dev. Use it if you already have it. Do not adopt it new in 2026.
Roarr — zero-cost when disabled, opinionated when on
Roarr's pitch is 'every log call is free when the logger is off.' It uses environment-variable gating (`ROARR_LOG=true`) and renders calls to no-ops at module load when disabled. Excellent for libraries that want to log without forcing a dependency on consumers. Less compelling for application code, where you generally want logs on.
The hot-path / cold-path logging architecture
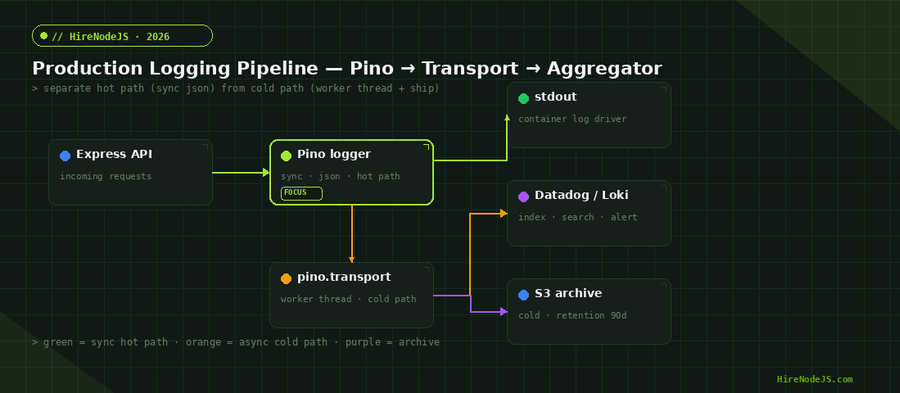
The single most impactful pattern in 2026 production Node.js logging is separating the hot path (what runs inside the request handler) from the cold path (what ships the log line to its destination). The hot path must be synchronous, allocation-light, and as close to a `write()` call as possible. The cold path can be asynchronous, batched, and run on a worker thread. Mixing the two is how Winston deployments end up with 3ms of latency overhead per log line.
Pino's `pino.transport` API expresses this split natively. The main thread JSON-encodes the log line and writes it to a `SonicBoom` stream. The transport worker thread reads from that stream and forwards the line to wherever it needs to go — file with rotation, Datadog HTTPS API, Loki push endpoint, S3 archive. Crashes in the transport never take down the main thread.
Hire Pre-Vetted Node.js Developers
Skip the months-long search. Our exclusive talent network has senior Node.js experts ready to join your team in 48 hours.
Configuring pino.transport correctly
A production-grade Pino setup looks like the snippet below. The transport file uses a separate process — the worker thread cannot block your event loop even if Datadog is having an incident.
import pino from 'pino';
import { trace } from '@opentelemetry/api';

const transport = pino.transport({
  targets: [
    // Always write to stdout — captured by your container log driver
    { target: 'pino/file', options: { destination: 1 }, level: 'info' },
    // Ship to Datadog asynchronously
    {
      target: 'pino-datadog-logs',
      options: {
        ddClientConf: { authMethods: { apiKeyAuth: process.env.DD_API_KEY } },
        ddServerConf: { site: 'datadoghq.com' },
        service: 'checkout-api',
      },
      level: 'info',
    },
  ],
});

export const logger = pino(
  {
    level: process.env.LOG_LEVEL ?? 'info',
    // Attach the active trace ID to every log line
    mixin() {
      const span = trace.getActiveSpan();
      if (!span) return {};
      const ctx = span.spanContext();
      return { trace_id: ctx.traceId, span_id: ctx.spanId };
    },
    // Redact sensitive fields automatically
    redact: {
      paths: ['req.headers.authorization', 'req.headers.cookie', '*.password', '*.token'],
      remove: true,
    },
    serializers: { err: pino.stdSerializers.err, req: pino.stdSerializers.req },
    timestamp: pino.stdTimeFunctions.isoTime,
  },
  transport
);
Structured logging — fields, levels, and correlation IDs
Structured logging means every log line is a JSON object with predictable, queryable fields. Not just `msg`, but `req_id`, `user_id`, `trace_id`, `duration_ms`, `route`. Once your logs are structured, you stop grepping and start querying — 'show me every 500 on /checkout from users in EU in the last hour' becomes a single query in Loki or Datadog instead of a one-hour incident.
Child loggers — context that travels with the request
Every modern logger supports child loggers, but Pino's implementation is the cheapest. A child logger inherits its parent's bindings and adds its own — perfect for attaching a request ID at the top of the middleware chain and having every downstream log line carry it automatically. Combined with AsyncLocalStorage, you do not need to pass a `logger` instance through every function call.
If you have not yet adopted AsyncLocalStorage for request context, our AsyncLocalStorage in 2026 guide covers the exact pattern for stitching a request ID through your entire call stack — including across awaits and worker pools.
Log levels — fewer is better
Most teams use too many log levels. In production you really only need three: `info` for normal operation, `warn` for things that are wrong but recoverable, and `error` for things that page someone. `debug` and `trace` should be off in production by default and toggled on per-instance via a control-plane flag for short investigation windows. Logging everything at `info` and then trying to grep your way out is the most common Node.js logging anti-pattern in 2026.
Migrating from Winston to Pino without a rewrite
If your service is on Winston and you cannot afford a full rewrite, you can migrate in three steps. First, install Pino alongside Winston and route both to the same destinations. Second, swap module-by-module by replacing the imported logger; Pino's API surface for `info/warn/error/child` matches Winston closely enough that a regex find-and-replace gets you 80% of the way. Third, retire Winston once the metrics dashboard shows zero callers.
Common migration pitfalls
Three traps catch most teams. Pino's `error` argument is a special key — passing `logger.error(err, 'oops')` is correct; the reverse pollutes your log shape. Pino emits ndjson, so any code that parses logs with `JSON.parse` on the whole file must switch to line-by-line. And Pino's default level is `info`; if your Winston was set to `silly`, your logs will visually shrink, which is usually the right outcome but always surprises someone.
Hire Expert Node.js Developers — Ready in 48 Hours
Building the right logging pipeline is only half the battle — you need the right engineers to wire it through your services, your aggregators, and your alert rules. HireNodeJS.com specialises exclusively in Node.js talent: every developer is pre-vetted on real-world projects including observability, high-throughput APIs, event-driven architecture, and production deployments.
Unlike generalist platforms, our curated pool means you speak only to engineers who live and breathe Node.js. Most clients have their first developer working within 48 hours of getting in touch. Engagements start as short-term contracts and can convert to full-time hires with zero placement fee.
Summary — your 2026 logging stack in one paragraph
In 2026, the safe Node.js logging stack is Pino on the hot path, `pino.transport` worker thread on the cold path, stdout as the always-on backstop, and a managed aggregator (Datadog, Loki, or Sentry) for indexed search. Wire OpenTelemetry trace IDs in via Pino's `mixin`, redact sensitive headers automatically, keep your levels to info/warn/error, and resist the temptation to log everything. The 3.3x throughput win versus Winston is real, the latency win is measurable in your p99 dashboard, and the cost win — typically 25–35% of fleet CPU — pays for the migration in the first month. If you are still on Winston in 2026 and serving more than 1k req/sec, you are running a tax on every request. Need help making the move? Hire a senior Node.js engineer who has done this migration before — most clients have a developer shipping changes within 48 hours.
Frequently Asked Questions
Is Pino really faster than Winston in 2026?
Yes — by roughly 3x on typical JSON workloads. Our 2026 benchmark on an m7g.large shows Pino sustaining ~61k req/sec under 100k log lines versus Winston at ~24k. The gap comes from Pino doing synchronous JSON-only work on the hot path and offloading transports to a worker thread.
Should I use console.log in production Node.js apps?
No. console.log is synchronous, writes to stdout without buffering, has no log levels, no structured output, and no redaction. Use Pino with stdout as the destination — you get the same simplicity plus JSON, levels, and child loggers, and your aggregator can index every line.
How do I add trace IDs to every log line?
Use Pino's mixin option to read the active OpenTelemetry span on every log call and attach trace_id and span_id. This works across awaits because OpenTelemetry uses AsyncLocalStorage internally. The whole setup is about ten lines of code and gives you trace-to-log correlation in Datadog, Loki, or Honeycomb.
What is pino.transport and do I need it?
pino.transport runs a worker thread that handles all I/O — file rotation, shipping to Datadog, S3 archive. You almost always want it, because it keeps the main event loop free even when your aggregator has an incident. The only time you skip it is in serverless runtimes where worker threads are not supported.
Is Bunyan still maintained in 2026?
No — the original repo has been quiet since 2019, though there are forks. Existing Bunyan deployments are fine, but new services should pick Pino, which uses the same JSON-on-stdout convention Bunyan invented and adds active maintenance plus a worker-thread transport model.
How much does it cost to hire a Node.js observability engineer?
A senior Node.js engineer with strong observability experience typically bills $80–$140/hour depending on region and engagement length. HireNodeJS connects you with pre-vetted engineers within 48 hours, with no recruiter fees and the option to convert contracts to full-time hires.
Vivek Singh is the founder of Witarist and HireNodeJS.com — a platform connecting companies with pre-vetted Node.js developers. With years of experience scaling engineering teams, Vivek shares insights on hiring, tech talent, and building with Node.js.
Need a Node.js engineer who's wired up production observability before?
HireNodeJS connects you with pre-vetted senior Node.js engineers available within 48 hours — experienced in Pino, OpenTelemetry, Datadog, and high-throughput production logging. No recruiter fees, no lengthy screening.