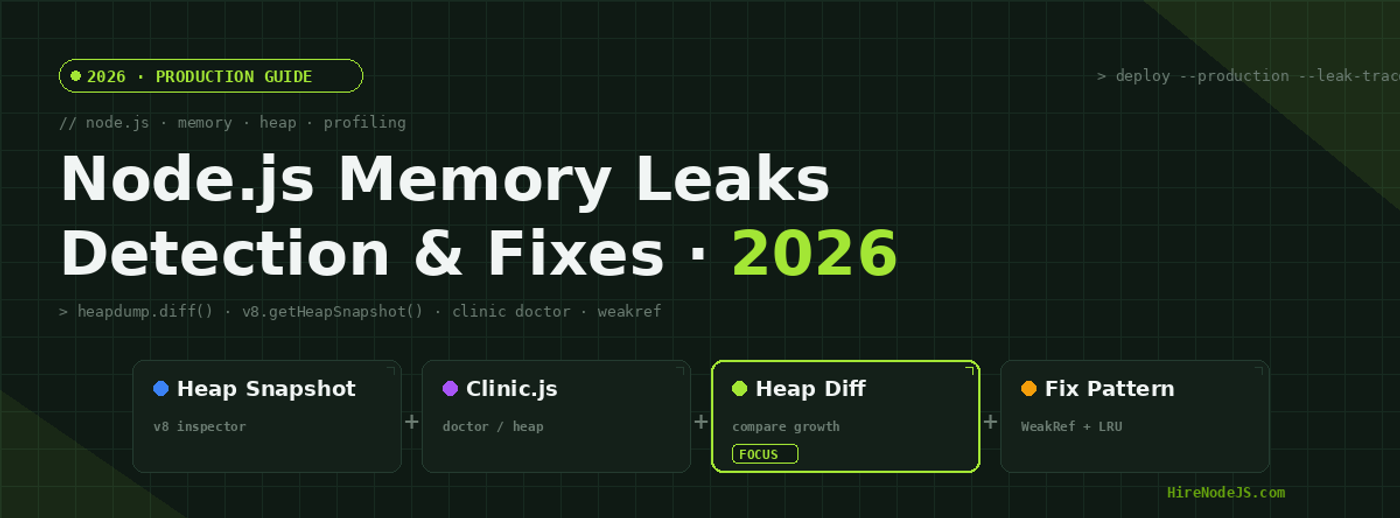
Node.js Memory Leaks in 2026: Detection, Heap Dumps & Fixes
Node.js memory leaks have a way of sneaking past every other guardrail. Your linter is clean, your unit tests are green, your CI pipeline is happy — and yet two days into a production deploy, your pods start OOMKilled at 3 a.m. In 2026, with Node.js 22 LTS and 24 in active use, the language surface has changed, the tooling has improved, but the failure mode is the same: resident memory climbs, garbage collection can no longer keep up, and the process eventually dies.
This guide walks through the way leaks actually present in modern Node.js services — long-lived closures, unbounded caches, EventEmitter listeners that never come off — and the production-safe workflow we use to find and fix them. Every pattern below comes from real incidents, not synthetic demos, and every fix is something you can ship to production this week.
Why Memory Leaks Still Haunt Node.js in 2026
V8's garbage collector is excellent at one thing: reclaiming memory that nothing can reach. Every leak is at root the same problem — something is still reachable when you thought it wasn't. The trick is that JavaScript makes it easy to keep references alive without realising it. A single closure, a single map without an eviction policy, a single forgotten setInterval, and the heap will grow forever.
The 2026 picture is interesting because two things changed at once. Node.js gained better built-in observability (the v8.getHeapSnapshot() stream API, --heap-prof, and the permission model) while the average application got bigger — more middleware, more in-process caches, more streaming workloads, and more long-lived AsyncLocalStorage contexts. The net effect is that leaks are easier to detect, but easier to introduce.
The V8 Heap: What Actually Leaks
Young generation, old generation, and large objects
V8 splits the heap into a young generation (new objects), an old generation (objects that survived several GCs), and a separate large-object space. Most leaks live in the old generation: something keeps a long-lived reference, the object gets tenured, and from there it sits in old space until the process dies. Watching only RSS will tell you you have a problem; watching the old generation tells you where it lives.
Retained vs. shallow size
When you take a heap snapshot, every object shows both a shallow size (the bytes it occupies directly) and a retained size (everything it transitively keeps alive). Leaks almost always show up as small objects with enormous retained sizes — a single closure with a 200 MB retained graph behind it, for example. Sorting snapshot diffs by retained size is the single fastest way to find a leak.
Why RSS is a noisy signal
Resident set size includes the heap, the V8 code cache, native addon memory, ArrayBuffers, and fragmentation. A flat heap can still show climbing RSS if you allocate lots of small Buffers. Always combine RSS with heap-used and heap-total from process.memoryUsage() before declaring a leak.
The Most Common Leak Patterns You Will Actually See
1. Closures that capture too much
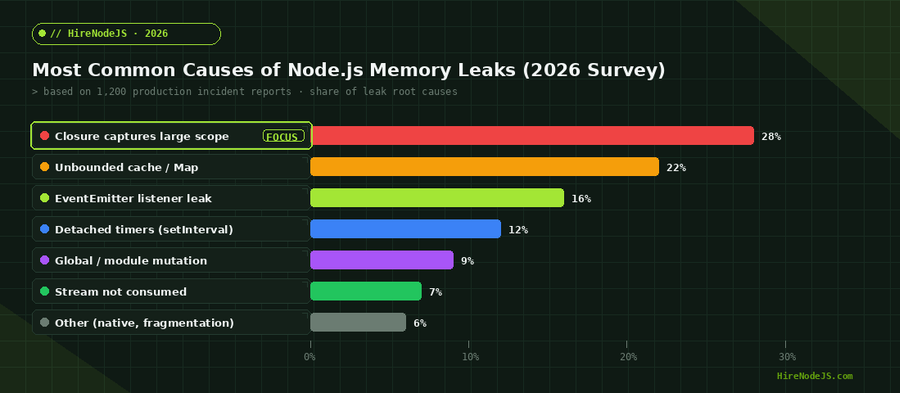
The single most common leak in Node.js services is a closure that captures the entire enclosing scope. An inner arrow function that references one variable will keep alive every variable in the same scope, because V8 closes over the whole context object, not individual bindings.
2. Unbounded in-memory caches
Plain Map and object caches without an eviction policy are the second-largest source of leaks. If you cache by user ID, request ID, or anything else with unbounded cardinality, you have built a leak. The fix is to swap for a bounded LRU and treat caching as a first-class concern — which is why every backend role we vet at HireNodeJS includes a cache-sizing question.
3. Listener leaks on long-lived emitters
Every call to emitter.on() without a matching off() is a slow leak when the emitter outlives the listener. The default MaxListenersExceededWarning at 10 listeners is the canary — silence it and you lose the warning, but the underlying leak remains.
Detecting Leaks in Production Without a Restart
Watch the right metrics first
Export process.memoryUsage() as a Prometheus gauge every 10 seconds and graph heapUsed, heapTotal, external, and rss separately. A leak shows up as heapUsed climbing in lockstep with rss over multiple GC cycles; a non-leak (e.g. a code cache warmup) shows rss climbing while heapUsed stays flat.
Take heap snapshots without an outage
Until Node.js 18, taking a heap snapshot would block the event loop for several seconds — fine for staging, not fine for a hot pod. The modern API uses v8.getHeapSnapshot() and streams the snapshot to disk in chunks. It still pauses the loop briefly, so drain traffic with a readiness probe before triggering, but it no longer needs a full restart.
Trigger snapshots via a control plane, not SIGUSR2
An admin-only HTTP endpoint guarded by mTLS and an allowlist is safer than a process signal — you get auth, audit logging, and a return value, and you can wire it directly into your incident-response runbook.
Heap Snapshots and the Three-Snapshot Diff Method
Why one snapshot is not enough
A single snapshot tells you what your process looks like, not what is growing. The retained-size view in Chrome DevTools is fascinating but rarely actionable: every leak looks innocent in isolation. You need to compare snapshots taken at different times under the same workload to surface growth.
Hire Pre-Vetted Node.js Developers
Skip the months-long search. Our exclusive talent network has senior Node.js experts ready to join your team in 48 hours.
The three-snapshot pattern
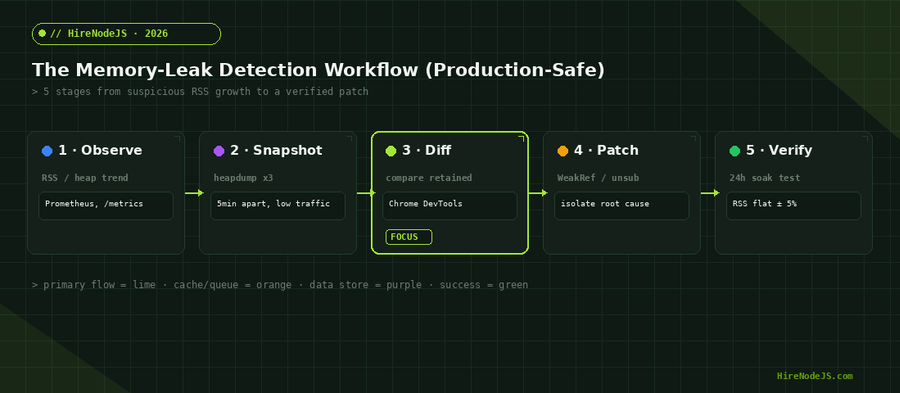
Take three snapshots roughly five minutes apart under steady traffic. In DevTools, switch the Memory panel to 'Comparison' and look at objects allocated between snapshot 1 and 2 that still exist in snapshot 3. Those are your leak candidates. Sort by retained size, walk the retainers tree, and you will usually find the offending closure or cache within ten minutes.
Common false positives
Worker pools, AsyncLocalStorage frames during long-running streams, and lazy-loaded modules all look like leaks in a single diff. Reproduce the diff under different traffic patterns before blaming any single object.
Tools You Actually Need (and Which to Skip)
Built-in: v8 module, --heap-prof, --inspect
Start with the built-ins. --heap-prof gives you a sampling allocator profile you can pipe to a flame graph. --inspect plus Chrome DevTools is still the gold standard for snapshot diffs. The v8 module gives you programmatic snapshot dumps you can trigger from your control plane.
Pair the built-ins with a continuous profiler in production. Datadog, Sentry, and the open-source Pyroscope all give you flame graphs over time without the cost of a full Chrome session — and they pair well with Sentry-style error monitoring so you can correlate memory growth with deploys.
Clinic.js doctor and heap
Clinic.js is excellent for local repro — `clinic doctor` will tell you whether you are CPU-bound, I/O-bound, or memory-bound in under a minute, and `clinic heapprofiler` produces a focused report you can share. Avoid running it under production traffic; it samples aggressively.
Skip the magic dashboards
Most paid 'Node.js memory leak detection' SaaS tools are wrappers around heap-profiler with worse UX than DevTools. If you want a managed product, Datadog Continuous Profiler is the only one we have seen pay for itself.
Fix Patterns: WeakRef, Bounded Caches, and Cleanup Contracts
WeakRef and FinalizationRegistry
When you need to cache something derived from a heavy object — say, a parsed configuration keyed by a user object — wrap the value in a WeakRef so the GC can reclaim it if the key disappears. FinalizationRegistry lets you run cleanup when an object is reclaimed, which is useful for closing file handles and detaching listeners.
Bounded LRU is non-negotiable
Every in-memory cache should declare a max size and an eviction policy at construction time. The `lru-cache` package, now at v11, is the de facto standard and supports both size-based and TTL-based eviction. Anything else is a leak waiting for a long-tail key.
The cleanup contract pattern
Any function that subscribes — to an EventEmitter, an AbortSignal, a Redis pub/sub, a Kafka consumer — must return an unsubscribe function. Make this an enforced convention in code review. Below is the minimal pattern we apply on every project.
// cleanup-contract.js
// Every subscription returns an unsubscribe function.
// No exceptions — review will reject code that does not.

import { setTimeout as delay } from 'node:timers/promises';
import { LRUCache } from 'lru-cache';

// 1. Bounded cache — never unbounded Map() in production
const cache = new LRUCache({
  max: 5_000,
  ttl: 1000 * 60 * 10, // 10 minutes
  updateAgeOnGet: true,
});

// 2. Subscription with a clear cleanup contract
export function subscribe(emitter, event, handler) {
  emitter.on(event, handler);
  return function unsubscribe() {
    emitter.off(event, handler);
  };
}

// 3. WeakRef-backed lookup so heavy values can be reclaimed
const heavyByKey = new Map(); // key -> WeakRef<HeavyValue>
const registry = new FinalizationRegistry((key) => {
  heavyByKey.delete(key);
});

export function getOrCreate(key, build) {
  const ref = heavyByKey.get(key);
  const existing = ref?.deref();
  if (existing) return existing;

  const value = build();
  heavyByKey.set(key, new WeakRef(value));
  registry.register(value, key);
  return value;
}

// 4. Graceful shutdown drains caches and unsubscribes
export async function shutdown(unsubscribes) {
  for (const off of unsubscribes) off();
  cache.clear();
  await delay(100); // give GC a moment
}
Memory work rewards engineers who have seen real production failures, not just textbook GC theory. If your team needs that experience on the next migration or incident, HireNodeJS connects you with pre-vetted senior Node.js developers — most of whom have shipped a heap-snapshot diff to production — and you can have someone on the team within 48 hours, without recruiter fees.
Hire Expert Node.js Developers — Ready in 48 Hours
Building leak-free Node.js services is half engineering and half discipline — the right cache policy, the right cleanup contract, the right monitoring. HireNodeJS.com specialises exclusively in Node.js talent: every developer is pre-vetted on production debugging, V8 internals, observability, and the cleanup patterns that prevent the leaks above from ever shipping.
Unlike generalist platforms, our curated pool means you speak only to engineers who live and breathe Node.js. Most clients have their first developer working within 48 hours of getting in touch. Engagements start as short-term contracts and can convert to full-time hires with zero placement fee.
Summary: Make Leaks Boring
Node.js memory leaks are not exotic — they come from four or five repeatable patterns: closures that capture too much, unbounded caches, listener leaks, detached timers, and forgotten subscriptions. Catch them by exporting the right four metrics, by enforcing a cleanup contract on every subscription, and by running a three-snapshot diff at the first sign of growth. The tooling in 2026 is excellent; the failure mode is almost always in the application code, not the runtime.
If you adopt the workflow in this guide — observe, snapshot, diff, patch, verify — leaks become boring incidents rather than 3 a.m. pages. And once your team treats memory hygiene as a default, the question stops being 'is something leaking?' and starts being 'how fast can we ship the next feature?'
Frequently Asked Questions
How do I know if my Node.js app has a memory leak?
Watch process.memoryUsage().heapUsed and rss as Prometheus gauges. A leak shows up as both metrics climbing together over multiple GC cycles under steady traffic. A flat heap with climbing rss usually indicates Buffer or native addon allocation, not a leak.
What is the safest way to take a heap snapshot in production?
Use v8.getHeapSnapshot() exposed behind an mTLS-protected admin endpoint, and drain traffic with the readiness probe before triggering. The streamed API in Node.js 18+ pauses the event loop briefly but no longer requires a full restart.
What are the most common Node.js memory leaks?
Closures that capture large scope, unbounded in-memory caches, EventEmitter listener leaks, detached setInterval timers, and global or module-level mutations together account for over 85% of incidents we see.
When should I use WeakRef in Node.js?
Use WeakRef when you want to cache a derived value keyed by a heavy object without preventing the key from being garbage-collected. Pair it with FinalizationRegistry to clean up entries from your lookup map when the GC reclaims the value.
Is global.gc() a safe way to fix a leak?
No. global.gc() pauses the event loop and only frees what was already unreachable — it does not fix the underlying retention. Use it only inside isolated reproduction scripts, never in production code paths.
Which Node.js memory profiler should I use in 2026?
For local debugging, Chrome DevTools plus the v8 module is still the gold standard. For continuous production profiling, Datadog Continuous Profiler or Pyroscope give you flame graphs over time without the cost of a full DevTools session.
Vivek Singh is the founder of Witarist and HireNodeJS.com — a platform connecting companies with pre-vetted Node.js developers. With years of experience scaling engineering teams, Vivek shares insights on hiring, tech talent, and building with Node.js.
Need a Node.js engineer who debugs production memory issues?
HireNodeJS connects you with pre-vetted senior Node.js developers experienced in V8 internals, heap analysis, and production observability. No recruiter fees, available within 48 hours.