
Node.js Logging with Pino in 2026: Structured Logs at Scale
If your Node.js app still streams unstructured strings to stdout, your future self will not thank you. By 2026, logs are no longer just for tailing in a terminal — they feed alerting pipelines, security audits, billing reconciliation, and ML-driven anomaly detection. Logs have become structured events with strict schemas, and the logger you pick directly affects request latency, infrastructure cost, and on-call sanity.
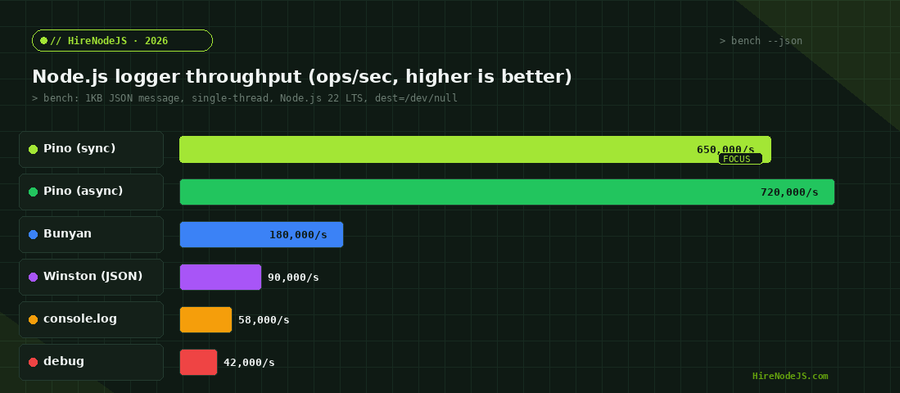
Pino has emerged as the default high-performance logger for production Node.js services. It hits 600k+ ops/sec on a single thread, emits valid JSON without external schemas, and ships transports for everything from rotating files to Loki, Datadog, and OpenTelemetry. This guide covers the patterns that production teams use in 2026 — including transport workers, redaction for compliance, child loggers for request tracing, and the storage architecture that keeps your log bill under control.
Why structured JSON logging won in 2026
Five years ago, sprintf-style logs were still acceptable for small services. That window has closed. Modern observability vendors — Loki, Datadog, ClickStack, OpenSearch — index on JSON fields. If your logs are unstructured strings, you pay for full-text indexing, lose dimensional querying, and break correlation with traces and metrics.
The cost of unstructured logs
Unstructured logs roughly double your ingest bill because every field becomes a string to tokenize. They also block automation: you cannot build an alert on `error.code === "DB_TIMEOUT"` if your error is a free-form sentence. With structured JSON, every log line is a queryable event — and Pino was designed for exactly that, with no per-field overhead and no synchronous schema validation in the hot path.
OpenTelemetry alignment
OpenTelemetry's Logs Data Model now expects JSON severity numbers (10–22), trace correlation fields, and a strict `body` shape. Pino emits this nearly out of the box, and the OpenTelemetry guide for Node.js walks through the bridge if you need to ship logs alongside traces. Compare that to legacy loggers where you write a custom formatter and pray.
Setting up Pino correctly the first time
A two-line setup gets you JSON logs to stdout, but production demands a few more choices: level, timestamp format, base context, and how you handle pretty-printing in development. The setup below covers every real-world need without hidden cost in the hot path.
The production logger
import pino from 'pino';

// One logger, configured once at boot. Reuse via child loggers.
export const logger = pino({
  level: process.env.LOG_LEVEL ?? 'info',
  // ISO timestamps are easier on humans and on Loki/Grafana parsing.
  timestamp: pino.stdTimeFunctions.isoTime,
  // Context every line will carry — service name, env, region, version.
  base: {
    service: process.env.SERVICE_NAME ?? 'api',
    env: process.env.NODE_ENV,
    region: process.env.AWS_REGION ?? 'local',
    rev: process.env.GIT_SHA?.slice(0, 7),
  },
  // Redact sensitive paths before they ever leave the process.
  redact: {
    paths: [
      'req.headers.authorization',
      'req.headers.cookie',
      '*.password',
      '*.token',
      '*.creditCard',
    ],
    censor: '[REDACTED]',
  },
  // In development, prefer human-readable. Never use this in prod — it costs ~25x.
  transport: process.env.NODE_ENV === 'development'
    ? { target: 'pino-pretty', options: { colorize: true, translateTime: 'SYS:HH:MM:ss' } }
    : undefined,
});
Child loggers, request IDs and correlation
The single biggest debugging upgrade you can ship is per-request correlation IDs. With a child logger bound to the request, every log line inside that request shares an `req_id` field — making it trivial to filter to one user's timeline in Loki or Grafana.
AsyncLocalStorage + request ID middleware
This pattern combines Node's AsyncLocalStorage with a Pino child logger. The child carries the request ID, user ID, and trace ID across every await without you passing it manually. If your services already use Express 5 or Fastify, this drops in with no framework lock-in.
import { AsyncLocalStorage } from 'node:async_hooks';
import { randomUUID } from 'node:crypto';
import { logger } from './logger.js';

export const als = new AsyncLocalStorage();

// Express/Fastify-agnostic middleware.
export function requestLogger(req, res, next) {
  const req_id = req.headers['x-request-id'] ?? randomUUID();
  const child = logger.child({
    req_id,
    method: req.method,
    path: req.url.split('?')[0],
    // OpenTelemetry trace id, if you have an OTel-instrumented stack.
    trace_id: req.headers['traceparent']?.split('-')[1],
  });

  res.setHeader('x-request-id', req_id);

  als.run({ logger: child, req_id }, () => {
    const start = process.hrtime.bigint();
    child.info('req.start');

    res.on('finish', () => {
      const ms = Number(process.hrtime.bigint() - start) / 1e6;
      child.info({ status: res.statusCode, ms: +ms.toFixed(2) }, 'req.end');
    });

    next();
  });
}

// Anywhere downstream — handlers, services, queries.
export const log = () => als.getStore()?.logger ?? logger;
Transports and the worker thread escape hatch
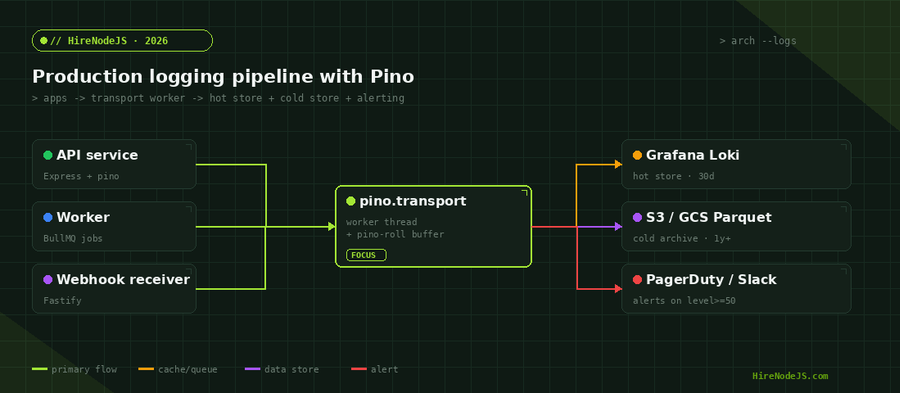
Pino's transports run in a separate worker thread by default. This is the single most important design choice in the library — your main event loop is never blocked by I/O to Loki, Datadog, or a file rotation. Everything you write goes into a small in-memory ring buffer, and the transport worker drains it asynchronously.
Hire Pre-Vetted Node.js Developers
Skip the months-long search. Our exclusive talent network has senior Node.js experts ready to join your team in 48 hours.
Sending logs to Grafana Loki
// transports/loki.js
import pino from 'pino';

const transport = pino.transport({
  targets: [
    // Primary: ship to Loki via pino-loki (worker thread).
    {
      target: 'pino-loki',
      level: 'info',
      options: {
        host: process.env.LOKI_URL,
        basicAuth: {
          username: process.env.LOKI_USER,
          password: process.env.LOKI_TOKEN,
        },
        labels: { service: process.env.SERVICE_NAME, env: process.env.NODE_ENV },
        batching: true,
        interval: 5, // seconds
      },
    },
    // Failover: also write to a rotating local file so we never lose lines.
    {
      target: 'pino-roll',
      level: 'warn',
      options: {
        file: '/var/log/app/app.log',
        frequency: 'daily',
        size: '50m',
        mkdir: true,
        limit: { count: 14 }, // keep 14 days
      },
    },
  ],
});

export const logger = pino({ level: 'info' }, transport);
When to keep transports OFF
In Kubernetes or AWS ECS, your container's stdout is usually already harvested by Fluent Bit, Vector, or the platform's built-in collector. In that case, do NOT enable a Pino transport — let the collector do its job. Transports inside the process are best for VMs, bare metal, or when you need application-aware enrichment that the collector cannot perform.
Redaction, PII and the compliance layer
Every team that ships to enterprise customers hits the same wall: a security review asks how PII flows through logs. The honest answer in 2026 is that nothing leaves the process unredacted, and Pino's built-in redaction makes this declarative.
Path-based redaction is fast and safe
Pino compiles redact paths to a single fast accessor function at startup, so redaction adds well under a microsecond per log line — fast enough to enable in the hot path. The trade-off is that you must enumerate the paths up front; runtime regex scanning of free-form strings is intentionally not supported because of the latency cost.
const logger = pino({
  redact: {
    paths: [
      // Headers
      'req.headers.authorization',
      'req.headers["x-api-key"]',
      'req.headers.cookie',
      // Common body fields
      '*.password',
      '*.passwordHash',
      '*.token',
      '*.refreshToken',
      '*.creditCard',
      '*.ssn',
      // Anything nested under user.profile.private
      'user.profile.private',
      // Wildcards expand at start time, not per-log.
      'order.items[*].buyer.email',
    ],
    censor: '[REDACTED]',
    remove: false, // keep the key, just replace the value
  },
});
The storage architecture that keeps your log bill sane
By far the most common Node.js logging mistake we see when auditing teams is sending every log to a managed vendor at full retention. A 100 GB/day stream into Datadog with 30-day retention will cost you about $5,000/month at list prices — and most of that data is never queried. The right shape in 2026 is a tiered pipeline.
Hot, warm, cold tiers
Send INFO and above to your hot store (Loki, ClickHouse, or Elasticsearch) with 7–30 day retention. Mirror everything to S3 or GCS in Parquet for cold archival at 1/100th the cost. Stream ERROR and FATAL to a separate alerting topic that triggers PagerDuty or Slack within seconds. This pattern is reflected in the architecture diagram above.
Sampling DEBUG and TRACE
DEBUG logs are valuable but enormous. Sample them at 1% in production with deterministic hashing on the request ID — that way, when you do see a debug log, you also see every related log line for the same request. Pino's `formatters.log` hook makes this trivial to implement without a custom transport.
Hire Expert Node.js Developers — Ready in 48 Hours
Building a production logging stack is one of those decisions that compounds. Get it right and you'll debug outages in minutes; get it wrong and you'll pay six-figure bills for logs you never read. HireNodeJS.com specialises exclusively in Node.js talent: every engineer has shipped production observability stacks, knows Pino, Loki, and OpenTelemetry, and has on-call experience at scale.
Unlike generalist platforms, our curated pool means you speak only to engineers who live and breathe Node.js. Most clients have their first developer working within 48 hours of getting in touch. Engagements start as short-term contracts and can convert to full-time hires with zero placement fee.
If your roadmap also touches backend architecture, DevOps and Kubernetes, or Redis-backed caching, the same vetting framework applies — only senior engineers with shipped production systems make it through.
Wrapping up: a logger you can scale with
Pino in 2026 is the boring, correct default for Node.js production logging. It's fast enough that you can leave it on at high volumes, structured enough that downstream tools can do real work, and flexible enough to fit Kubernetes, VMs, or serverless. Pair it with a tiered storage strategy, declarative redaction, and per-request correlation IDs, and you have a logging stack that scales from one node to one thousand without ever rewriting your application code.
The teams who win here treat logs as a product surface: budgeted, monitored, and reviewed quarterly. If yours feel like a black hole rather than a debugging asset, the patterns in this guide are where to start — and the right engineers will get you there faster than rolling your own.
Frequently Asked Questions
Is Pino still the fastest Node.js logger in 2026?
Yes. On Node.js 22 LTS, Pino sustains roughly 650k–720k ops/sec for 1KB JSON messages, which is 3–6x faster than Bunyan and 7–8x faster than Winston in JSON mode. Only Roarr comes close, but it lacks Pino's transport ecosystem.
Should I use Pino or Winston for a new Node.js project?
Pino, in nearly every case. Winston is older and has a richer formatter ecosystem, but the throughput gap is large, and modern Pino transports cover the same destinations. Pick Winston only if your team has a deep existing investment in custom Winston transports.
How do I correlate Pino logs with OpenTelemetry traces?
Inject the W3C traceparent header's trace_id and span_id into every log line via a child logger. Pino has first-class OpenTelemetry support through @opentelemetry/instrumentation-pino, which auto-correlates without you writing glue code.
Can I run Pino in serverless functions like AWS Lambda?
Yes — disable transports in Lambda (let CloudWatch ingest stdout) and use sync mode. Pino's transport workers don't survive Lambda's frozen execution model, so simpler is better. The Pino docs cover the sync configuration explicitly.
How much does Pino actually save on log storage costs?
The logger itself doesn't change storage cost — but its structured JSON output lets you send to cheap stores like Loki or self-hosted ELK instead of full-text-indexed managed log services. Most teams cut their log bill 60–80% just by moving from CloudWatch or Datadog to Loki on a hot/cold tier.
Is pino-pretty safe to use in production?
No. pino-pretty runs the formatter on the main event loop and reduces throughput by 20–30x. Use it only in development. In production, ship raw JSON and view it with Grafana, lnav, or kubectl logs | jq.
Vivek Singh is the founder of Witarist and HireNodeJS.com — a platform connecting companies with pre-vetted Node.js developers. With years of experience scaling engineering teams, Vivek shares insights on hiring, tech talent, and building with Node.js.
Need a Node.js engineer who ships observable, production-grade backends?
HireNodeJS connects you with pre-vetted senior Node.js engineers who've shipped Pino, OpenTelemetry and Loki at scale — available within 48 hours, no recruiter fees.