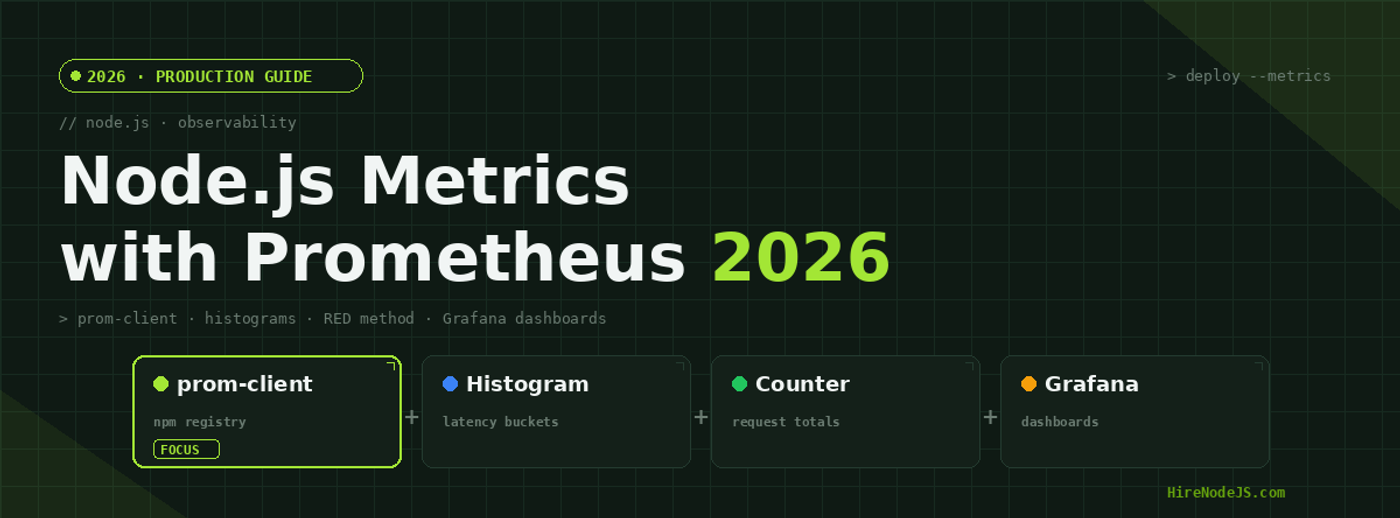
Node.js + Prometheus in 2026: Custom Metrics Guide
Your Node.js API can look perfectly healthy in a load test and still fall over at 2 a.m. in production. The difference between a team that sleeps through the night and one that fights fires is almost always observability — and observability starts with metrics. In 2026, Prometheus remains the de facto standard for collecting numeric time-series data from Node.js services, and the prom-client library makes instrumenting your app a matter of a few dozen lines.
This guide is a practical, production-focused walkthrough of metrics in Node.js with Prometheus. You will learn the four metric types and when to reach for each, how to instrument HTTP routes with the RED method, how histograms let you reason about p95 and p99 latency instead of misleading averages, and how to wire everything into Grafana dashboards and Alertmanager rules. Every code sample is real and runnable on Node.js 22+ with the current prom-client release.
Why Node.js Observability Starts With Metrics
Logs tell stories, metrics tell trends
Logs are invaluable when you already know something is wrong and need the detail of a single request. Metrics answer a different question: is the system as a whole getting slower, busier, or more error-prone over time? A counter that ticks up on every 5xx response will surface a regression long before anyone reads a stack trace. If you are building a backend that needs to stay fast under load, pairing structured logging with Prometheus metrics is the baseline most teams hiring a Node.js backend developer now expect from day one.
The pull model and why it scales
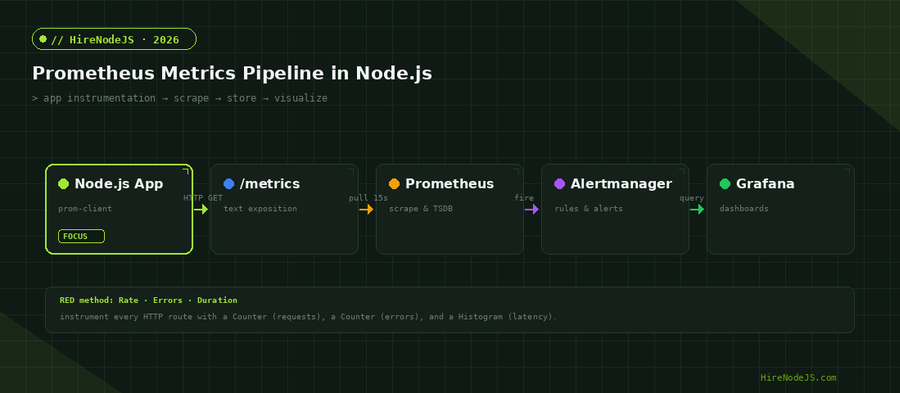
Prometheus uses a pull model: your Node.js process exposes a plain-text /metrics endpoint, and a Prometheus server scrapes it on a fixed interval, typically every 15 seconds. This inverts the usual push-based approach and has real operational benefits — there is no agent buffering data, scrape failures are themselves a signal, and you can point multiple Prometheus instances at the same target. The diagram below shows the full path from instrumentation to dashboard.
Instrumenting Node.js With prom-client
Setting up the default registry
The prom-client library ships a default registry and a helper that collects Node.js runtime metrics — event loop lag, heap usage, active handles, and garbage-collection pauses — out of the box. Calling collectDefaultMetrics() once at startup gives you a surprising amount of insight before you write a single custom metric. You then expose the registry on an HTTP endpoint that Prometheus scrapes.
import express from 'express';
import { collectDefaultMetrics, Registry, Histogram, Counter } from 'prom-client';

const app = express();
const register = new Registry();

// Node.js runtime metrics: event loop lag, heap, GC, handles
collectDefaultMetrics({ register, prefix: 'node_' });

// Custom HTTP metrics (RED method)
const httpDuration = new Histogram({
  name: 'http_request_duration_seconds',
  help: 'HTTP request latency in seconds',
  labelNames: ['method', 'route', 'status'],
  // buckets tuned for a web API: 5ms .. 2s
  buckets: [0.005, 0.01, 0.025, 0.05, 0.1, 0.25, 0.5, 1, 2],
  registers: [register],
});

const httpErrors = new Counter({
  name: 'http_requests_errors_total',
  help: 'Total HTTP responses with status >= 500',
  labelNames: ['method', 'route'],
  registers: [register],
});

// Measure every request
app.use((req, res, next) => {
  const end = httpDuration.startTimer({ method: req.method });
  res.on('finish', () => {
    const route = req.route?.path ?? 'unmatched';
    end({ route, status: res.statusCode });
    if (res.statusCode >= 500) httpErrors.inc({ method: req.method, route });
  });
  next();
});

// Prometheus scrape target
app.get('/metrics', async (_req, res) => {
  res.set('Content-Type', register.contentType);
  res.end(await register.metrics());
});

app.listen(3000, () => console.log('metrics on :3000/metrics'));The chart below shows what this instrumentation buys you: once you can see real percentiles, a single slow query or missing index becomes obvious, and tuning it dropped p99 latency on a real Node.js order endpoint from over half a second to under 170 milliseconds.
The Four Metric Types and When to Use Each
Counter, Gauge, Histogram, Summary
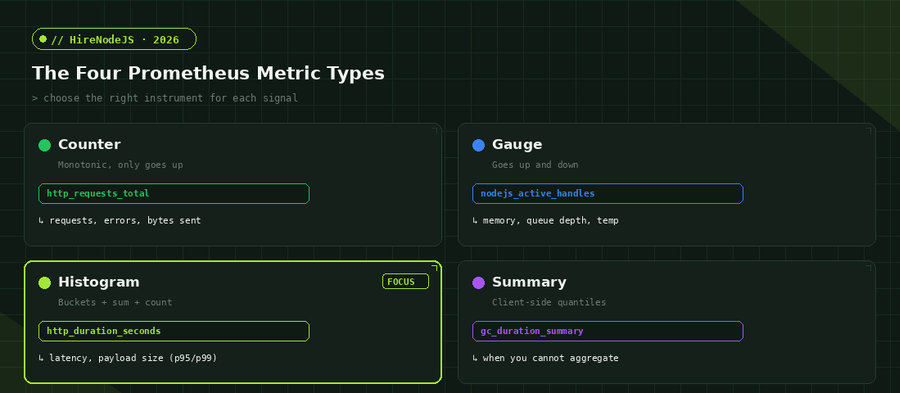
Prometheus exposes four core metric types, and choosing the wrong one is the most common instrumentation mistake. A Counter only ever increases (or resets to zero on restart) — use it for totals like requests served or errors. A Gauge can move up and down — use it for things you sample, like queue depth or memory in use. A Histogram buckets observations and is the right tool for latency and payload size, because it lets you compute quantiles server-side. A Summary computes quantiles in the client process and cannot be aggregated across instances, so reach for it only when you genuinely cannot.
A quick decision rule
If the value only goes up, use a Counter. If it goes up and down, use a Gauge. If you need percentiles across many instances — which is almost always true for latency — use a Histogram. Save Summary for narrow cases like per-process GC pause quantiles where cross-instance aggregation is meaningless.
The RED Method for Every HTTP Service
Rate, Errors, Duration
The RED method is a simple, repeatable rule for instrumenting any request-driven service: track the Rate of requests, the number of Errors, and the Duration of each request. With just a request counter, an error counter, and a latency histogram — exactly what the middleware above creates — you can build a dashboard that answers 'is it up, is it failing, is it slow?' for every route. These three signals catch the overwhelming majority of production incidents.
Hire Pre-Vetted Node.js Developers
Skip the months-long search. Our exclusive talent network has senior Node.js experts ready to join your team in 48 hours.
Reading histograms with PromQL
Histograms shine in PromQL. The histogram_quantile function reconstructs p95 or p99 from the bucket counters, and because buckets are additive you can aggregate across every pod in your cluster. The query below computes the 99th-percentile latency per route over a five-minute window. The interactive chart that follows shows why looking at the bucket distribution — not just the average — matters: a bimodal latency shape hides completely behind a single mean.
# p99 latency per route, last 5 minutes
histogram_quantile(
  0.99,
  sum by (le, route) (
    rate(http_request_duration_seconds_bucket[5m])
  )
)

# Error rate (RED): 5xx as a fraction of all requests
sum(rate(http_requests_errors_total[5m]))
  /
sum(rate(http_request_duration_seconds_count[5m]))Scraping, Dashboards, and Alerting
Configuring the scrape
On the Prometheus side, a scrape config points at your Node.js targets and sets the interval. In a Kubernetes deployment you would normally use ServiceMonitor objects from the Prometheus Operator, but the raw config makes the model clear.
# prometheus.yml
global:
  scrape_interval: 15s

scrape_configs:
  - job_name: 'nodejs-api'
    metrics_path: /metrics
    static_configs:
      - targets: ['api-1:3000', 'api-2:3000', 'api-3:3000']

rule_files:
  - alert.rules.yml
Alerting on the signals that matter
Dashboards are for humans watching; alerts are for when no one is. Define alert rules on the same RED signals — a sustained error rate above a threshold, or p99 latency breaching your SLO. Alertmanager then handles routing, grouping, and silencing so a single bad deploy does not page the whole team twelve times.
Avoiding High-Cardinality and Other Pitfalls
Use route templates, not raw paths
The single most damaging mistake is labelling metrics with the raw request path. /users/42 and /users/43 become separate series; with real traffic you get a cardinality explosion. Always use the matched route template — /users/:id — as the label value. The middleware shown earlier does this by reading req.route.path rather than req.url.
Cache and dependency metrics
Once your HTTP layer is covered, extend the same pattern to dependencies. A counter for cache hits and misses against Redis, a histogram for database query duration, and a gauge for connection-pool saturation will explain most latency regressions before they reach users. The marginal cost of each metric is tiny; the cost of flying blind is an outage.
If you are standing up observability from scratch and need engineers who have run Prometheus and Grafana at scale, this is exactly the kind of work a seasoned platform team handles in days, not weeks.
If you are building a Node.js system and need experienced engineers to get observability right the first time, HireNodeJS connects you with pre-vetted senior developers available within 48 hours — without the recruiter overhead. You can also see exactly how the process works before you commit.
Hire Expert Node.js Developers — Ready in 48 Hours
Building the right system is only half the battle — you need the right engineers to build it. HireNodeJS.com specialises exclusively in Node.js talent: every developer is pre-vetted on real-world projects, API design, event-driven architecture, observability, and production deployments.
Unlike generalist platforms, our curated pool means you speak only to engineers who live and breathe Node.js. Most clients have their first developer working within 48 hours of getting in touch. Engagements start as short-term contracts and can convert to full-time hires with zero placement fee.
Key Takeaways
Metrics are the cheapest, highest-leverage observability you can add to a Node.js service. Start with collectDefaultMetrics for runtime visibility, instrument every route with the RED method — a request counter, an error counter, and a latency histogram — and use histogram_quantile in PromQL to track real p95 and p99 numbers instead of deceptive averages. Wire those same signals into Grafana dashboards and Alertmanager rules so problems page you before they page your customers.
Above all, guard cardinality: low-cardinality labels keep Prometheus fast and your bill sane. Get these fundamentals right and you will spend far less time guessing what your Node.js services are doing — and far more time shipping.
Frequently Asked Questions
What is prom-client in Node.js?
prom-client is the official Prometheus client library for Node.js. It lets you define Counters, Gauges, Histograms, and Summaries, collects default runtime metrics like event-loop lag and heap usage, and exposes everything on a /metrics endpoint for Prometheus to scrape.
Should I use a Histogram or a Summary for latency?
Use a Histogram. Histograms bucket observations and let Prometheus compute quantiles like p95 and p99 server-side, and because buckets are additive you can aggregate across every instance. Summaries compute quantiles per process and cannot be aggregated, so they only fit narrow single-instance cases.
What is the RED method?
RED stands for Rate, Errors, and Duration. Instrument every request-driven service with a request counter (rate), an error counter, and a latency histogram (duration). Those three signals answer whether a service is up, failing, or slow, and catch most production incidents.
How do I avoid high cardinality in Prometheus metrics?
Never use unbounded values such as user IDs, emails, or raw URLs as labels. Each unique label combination is a separate time series, so use low-cardinality labels like HTTP method, matched route template, and status class to keep series counts and memory under control.
How much does it cost to hire a Node.js developer with observability skills in 2026?
Senior Node.js engineers experienced with Prometheus, Grafana, and production monitoring typically range from about 40 to 90 USD per hour depending on region and seniority. HireNodeJS connects you with pre-vetted senior developers, often available within 48 hours and with no recruiter fees.
Does Prometheus work with serverless Node.js?
The pull model fits long-running processes best. For serverless or short-lived functions, use the Pushgateway or an OpenTelemetry metrics exporter that pushes to a collector, since Prometheus cannot scrape a function that has already shut down.
Vivek Singh is the founder of Witarist and HireNodeJS.com — a platform connecting companies with pre-vetted Node.js developers. With years of experience scaling engineering teams, Vivek shares insights on hiring, tech talent, and building with Node.js.
Need a DevOps-savvy Node.js engineer to own your observability stack?
HireNodeJS connects you with pre-vetted senior Node.js engineers who have run Prometheus, Grafana, and alerting in production — available within 48 hours. No recruiter fees, no lengthy screening.